communication design
to stop climate change
communication design
to stop climate change
{ design toolbox }


polarity
maps

recent work
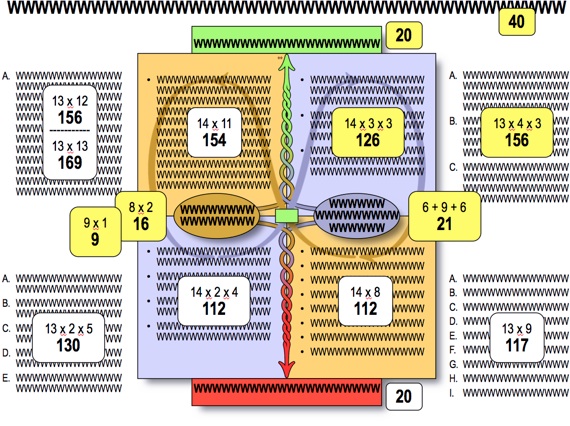


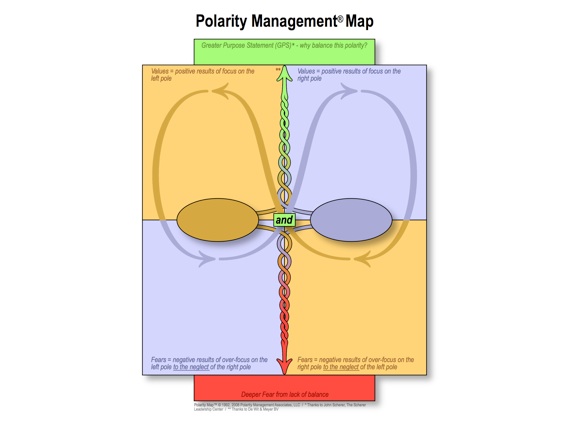


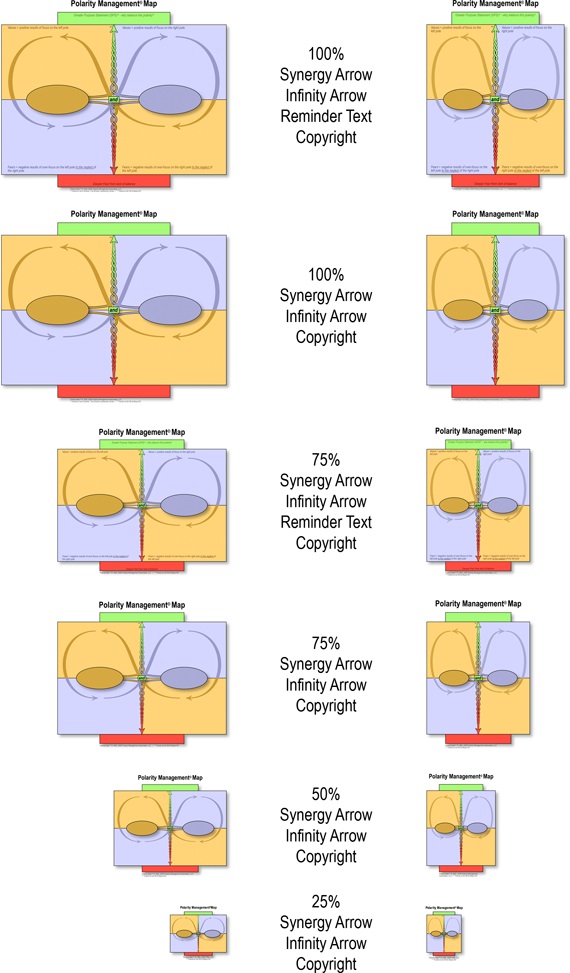
1. the polarity map
Thirty years ago Barry Johnson, Ph.D., literally wrote the book on Polarity Management, and the visual framework he conceived for his book was a map. Since then, the Polarity Map has been almost synonymous with Polarity Management consulting.
Every handful of years since 1992 PMA has had me design and refine the Polarity Map. But in anticipation of the construction of the PMAP software in 2008, we knew it was the best chance we’d get to maximize every element of the critical visual communication once and for all.


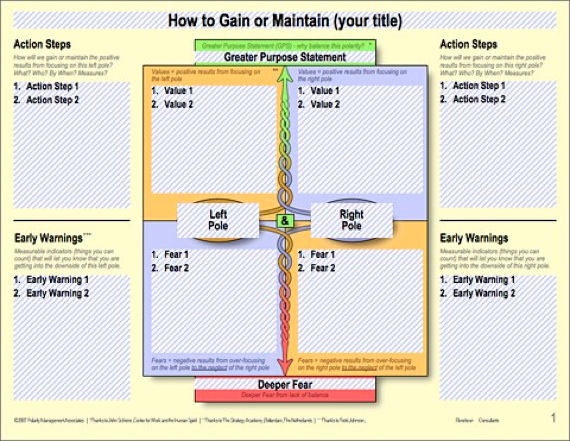
2. editable templates in powerpoint and word
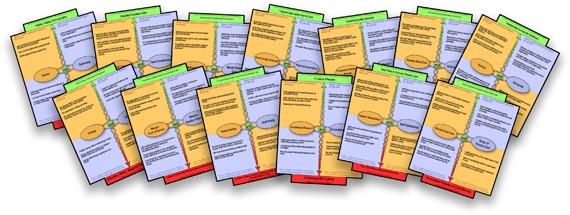
Few graphic assets got more mileage than the Polarity Map templates in PowerPoint and Word. But once text content for a consultant and their client fills the map, the information is incredibly dense. It was imperative that I use clean, clear typography and create a meticulous and well-spaced text grid.
PowerPoint and Word are the workhorses of consultants, but they are far from ideal vehicles for pixel-perfect template layouts with complex object grouping and layering. As a designer, this project felt like an interminable obstacle course of technical snafus. Countless hours and testing went into things like cross-platform font rendering, printable margins, lockable graphics, pre-formatted text fields, and maximum character count.
In the end, the most indispensable tool in the consultant’s toolbox got a world class upgrade. Meanwhile, Polarity Management gained a new set of editable templates to sell to their growing ranks of students and colleagues.
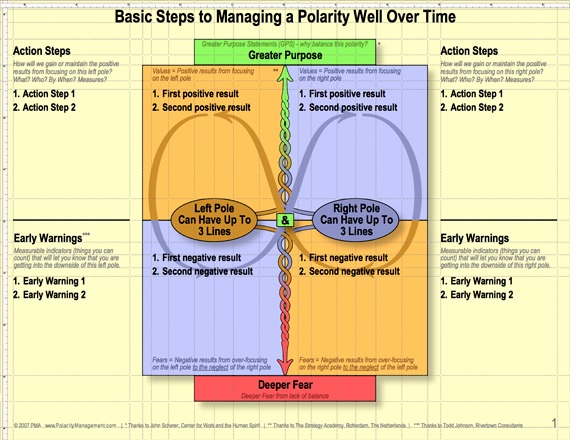
3. editable text zones, character counts, and layering
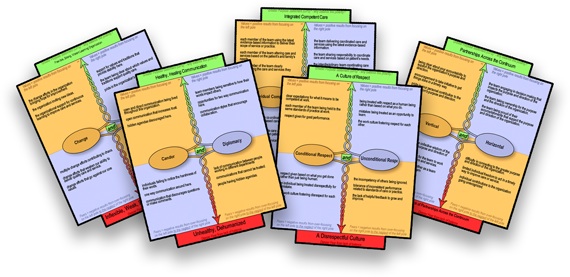
The editable Polarity Map templates were incredibly powerful, but also a bit daunting for consultants. To support the adoption and efficient use of the new tool, I created some supplemental explainers covering editable text zones, pre-formatted typography and maximum character counts, navigating groups and layers, and how to swap in any of the thousand infinity loops from the Polarity Management Arrow Library.
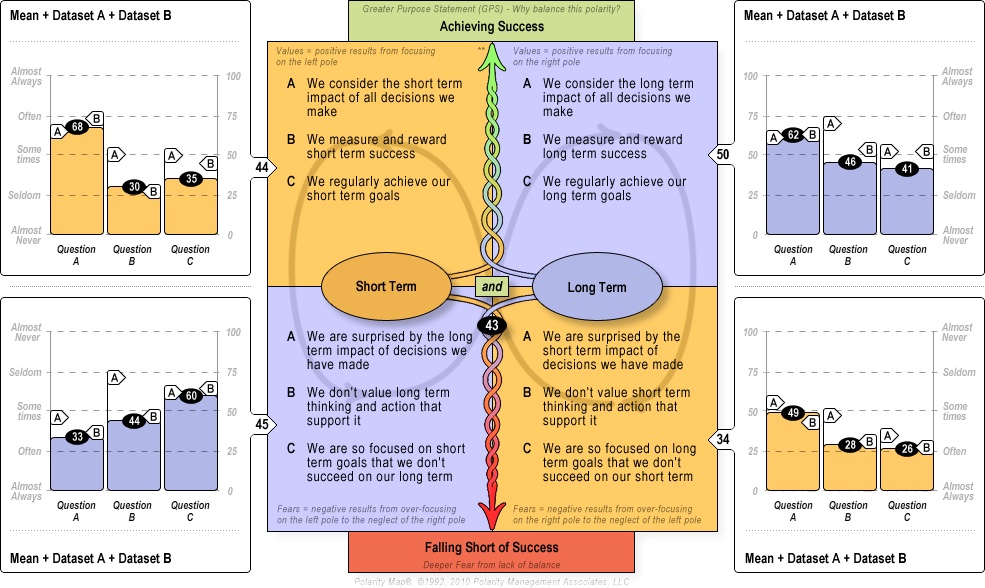
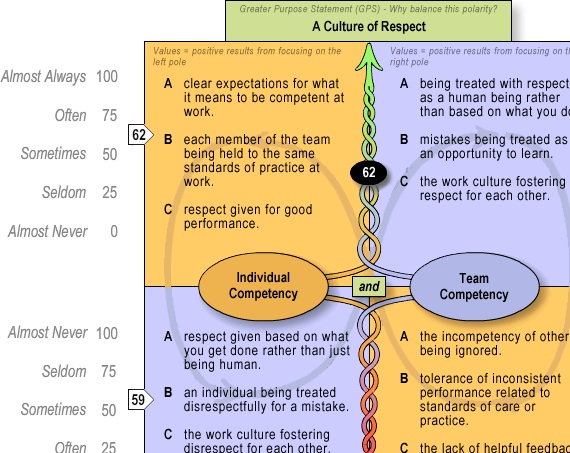
4. maps in the assessment software
Designing and coding highly interactive Polarity Maps for the new software was arguably the single greatest design and technology challenge of the entire project.
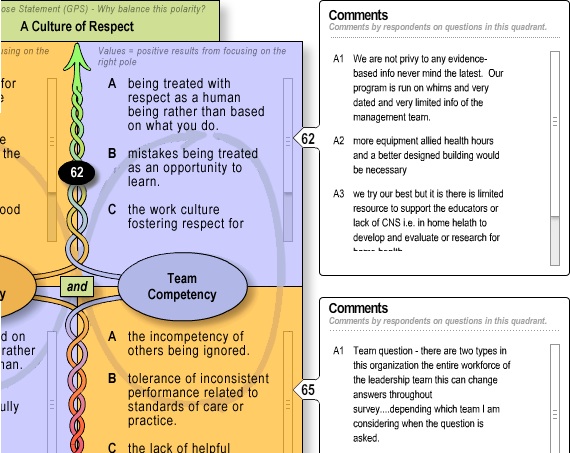
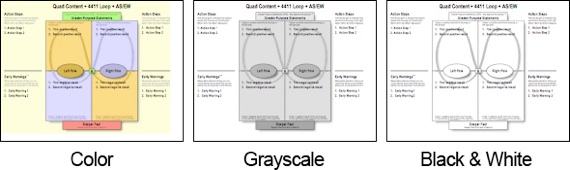
These maps needed to satisfy an extraordinary list of technical requirements: screen resolution, scrolling + editable text fields with integrated spell-check, font size and legibility, real-time reading level analysis, pixel-based maps overlayed with vector-based infinity loops, dynamically controlled by a live polling database, web color safe and grayscale convertible, permission-based sharing and collaboration, and complete integration within the interface of the entire PMAP tool.
It also needed to perform core functions for consultants: collect and prioritize data from the client organization, define titles for map, poles, purpose (top) and fears (bottom), zoom on screen, print off screen, store in library, duplicate, display results from client assessment feedback by map and by quadrant, sliceable by a matrix of demographics, and record, prioritize, store, and track client Action Steps and Early Warnings.
A tall order. We nailed it.